Home > Animals > Mammals > Cricetidae > California Mouse
Computer graphic of global internet traffic

![]()
Wall Art and Photo Gifts from Science Photo Library
Computer graphic of global internet traffic
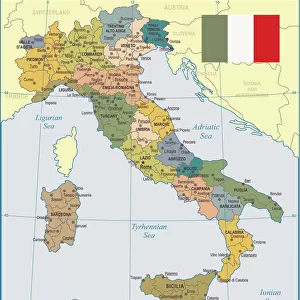
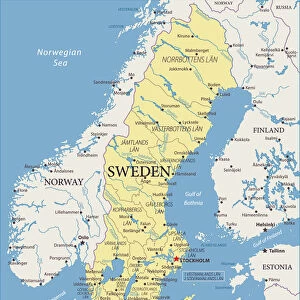
Internet traffic. Computer graphic of global internet traffic. Each line represents the path of sample data sent out to one of 20, 000 pre- selected locations using a system called Skitter. The lines are colour-coded to show the nationality of that part of the internet, for example: USA (pink), UK (dark blue), Italy (light blue), Sweden (light green) and white (unknown). The internet is a global computer network through which information can be shared. Maps like this will make moving around the internet easier, as well as showing when and where data jams occur. Made by the Cooperative Association for Internet Data Analysis, University of California, USA
Science Photo Library features Science and Medical images including photos and illustrations
Media ID 6441271
© CAIDA/SCIENCE PHOTO LIBRARY
Communication Global Global Communication High Tech Communications Internet Net Work Traffic
FEATURES IN THESE COLLECTIONS
> Animals
> Mammals
> Cricetidae
> California Mouse
> Europe
> Italy
> Related Images
> Europe
> Sweden
> Related Images
> Europe
> United Kingdom
> Maps
> Maps and Charts
> Italy
> Maps and Charts
> Related Images
EDITORS COMMENTS
This print showcases a computer graphic representation of global internet traffic, providing us with a visual insight into the complex network that connects our digital world. Each line in this intricate map represents the path taken by sample data sent to 20,000 pre-selected locations using an innovative system called Skitter. To enhance clarity, the lines are color-coded according to their respective nationalities. The vibrant hues reveal the origins of different parts of the internet: pink for USA, dark blue for UK, light blue for Italy, light green for Sweden, and white indicating unknown sources. This comprehensive visualization allows us to comprehend how information flows across borders and continents. Created by the Cooperative Association for Internet Data Analysis at the University of California in the USA, this remarkable map serves multiple purposes. Not only does it facilitate navigation within cyberspace but also helps identify areas where data congestion occurs. By pinpointing these bottlenecks on a global scale, scientists can work towards optimizing internet infrastructure and ensuring smoother communication worldwide. As technology continues to evolve rapidly and high-tech communications become increasingly vital in our lives, maps like this play an essential role in understanding and improving our interconnected online ecosystem. With its intricate details and insightful analysis provided by CAIDA's Skitter system, this image encapsulates both the beauty and complexity of global internet traffic – a testament to humanity's insatiable thirst for knowledge sharing through digital means.
MADE IN THE USA
Safe Shipping with 30 Day Money Back Guarantee
FREE PERSONALISATION*
We are proud to offer a range of customisation features including Personalised Captions, Color Filters and Picture Zoom Tools
SECURE PAYMENTS
We happily accept a wide range of payment options so you can pay for the things you need in the way that is most convenient for you
* Options may vary by product and licensing agreement. Zoomed Pictures can be adjusted in the Cart.